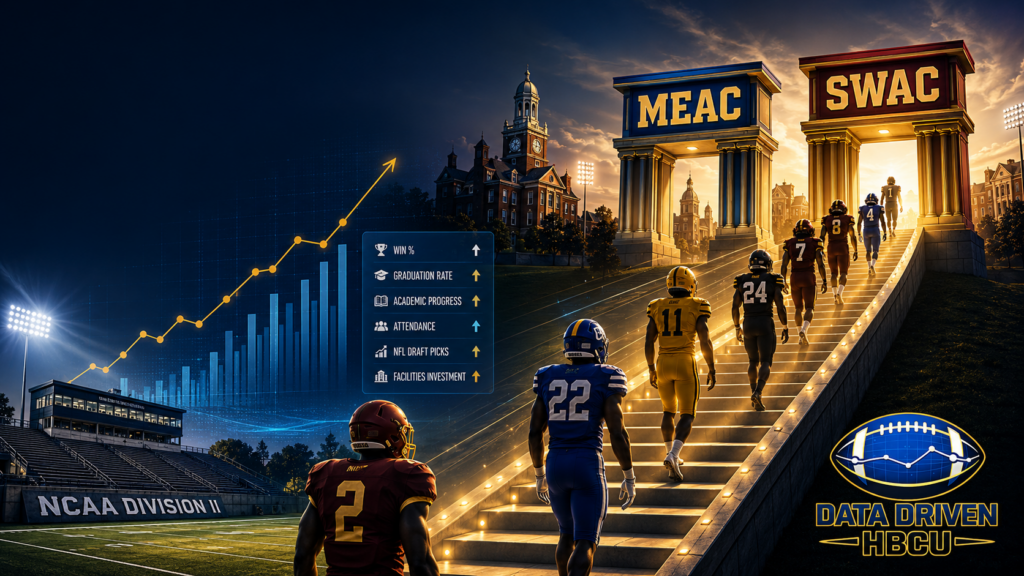
The question is not a new one. For years, HBCU fans and administrators have floated the idea of certain Division II powers making the jump to Division I and joining the MEAC or the SWAC, usually as offseason speculation that faded by kickoff. In early July, it moved from the message boards to the record when Morehouse College athletic director Harold Ellis went on a podcast and named the ambition directly. “The SWAC, the MEAC, we’re coming,” Ellis said. “Put us with the big dogs.” No paperwork has been filed, and Ellis framed it as an ambition rather than a plan. But his comments put a spotlight on a question that has lingered for a long time: among the Division II HBCUs, which ones actually look ready to compete at the next level?
The honest answer starts with a constraint that has nothing to do with any one school’s budget. A Division II program cannot simply decide to move up. The move only happens if the MEAC or the SWAC, the two Division I HBCU conferences, extends an invitation. Everything else is a prerequisite for being invited, not a substitute for it.
And as one athletic director has already made clear, even the schools with the strongest numbers are not necessarily ready to say yes. Virginia State University athletic director Tiffani-Dawn Sykes, whose program spends more on athletics than any other Division II HBCU, was asked directly about a MEAC move on the HBCU Sports podcast in late 2025 and answered “not today.” Her reasoning reframes what the spending data actually tells us, and it is worth understanding before reading the numbers.
What the Move Actually Requires
The NCAA rewrote the rules for this kind of move in January 2025, and the new framework changed both the timeline and the party carrying the burden of proof. The reclassification window for a Division II school was reduced to three years, lowering the cost and risk of the transition. But the requirements got more specific, and most of them run through the conference, doing the inviting.
Under the current rules, a conference bringing a Division II school into Division I has to confirm that the school clears an academic bar: it must sit above the 10th percentile of Division I members in at least one of three measures, the Academic Progress Rate, the Graduation Success Rate, or the gap between federal graduation rates for athletes and for the general student body. The school also has to pass an academic review, meet all of Division I’s core guarantees for athletes, complete an NCAA self-study, and satisfy a financial aid requirement, specifically a scholarship offering that exceeds the 10th percentile of active Division I members. Progress is measured year by year, and a school has to hit each year’s benchmarks to keep moving.
Two things follow from that. First, the inviting conference is the gatekeeper twice over: first, competitively, and then as the party that certifies academics. Second, the single hardest number to hit is the scholarship floor, because Division I football and basketball scholarship counts sit well above what most Division II programs currently fund.
What Reclassification Actually Costs
The eligibility rules are only half the picture. The other half is money, and the NCAA has studied in detail what the move would cost. Its analysis of schools that reclassified from Division II to Division I found that the move brought an average real increase in athletics spending of $3.7 million per year. Only about $500,000 of that, on average, was covered by new revenue from ticket sales, media deals, donors, and league distributions. That leaves roughly $3.2 million every year that a reclassifying school has to find elsewhere, typically through increased student fees, state support, or transfers from other parts of the campus budget.
The longer trend is just as steep. Looking at 19 schools that began the Division II to Division I move in 2004-05 or later, the NCAA found that athletic department expenses rose by an average of 96.1 percent, nearly doubling, in the five years before those schools reached active Division I status. The scale of a Division I football program is the reason. The median Division I football program at the level the MEAC and SWAC compete in spends around $17 million a year on athletics. The median Division II football program spends about $6.5 million. That gap is the mountain every school on this list would have to climb, and it is why the size and stability of the institution behind the athletic department matter as much as the current athletic budget.
This reframes the readiness question in an important way. The relevant test is not only how much a program spends today, but also whether the university behind it can generate about $3.2 million in new annual funding and sustain a near doubling of the athletics budget. That favors schools with large enrollments to draw student-fee revenue from or a state appropriation to lean on, and it raises a harder question for private institutions that cannot tap either source as easily.
The process itself adds cost and risk on top of that operating gap. A school cannot even apply to move up until it has a conference bid in hand, which is why the invitation is the true starting gun rather than a formality at the end. Once the process begins, there is a one-time application fee in the range of $1.5 million to $2 million, and the school spends several years ineligible for NCAA championships while it transitions, a real disadvantage in recruiting during the wait. Reporting on the recent wave of schools moving up found that those who successfully complete the jump tend to share two traits: they are already at the top of their current division in multiple sports, and they enter the process in a strong financial position. That is the profile a MEAC or SWAC invitation would be looking for.
Why the Biggest Budget Is Not the Same as Readiness
Sykes explained the gap between her program’s spending and an actual MEAC move in specific terms. Virginia State, she said, does not lack for resources in general. The problem is the breadth of what those resources have to cover. She described supporting 21 sports, and the issue is funding all of them at a Division I level rather than funding a smaller lineup well. If Virginia State sponsored 14 or 15 sports, she suggested, the move could happen quickly. Instead, the program has deliberately chosen to carry a wide slate of teams, joining conferences like the Peach Belt, the Gulf South, and the United States Collegiate Athletic Association to give athletes in every sport a place to compete for championships.
That distinction matters for how the rest of this analysis should be read. A large total athletics budget can mean one of two very different things. It can signal a deep, concentrated investment in the sports a Division I conference cares most about, or it can reflect a program that spreads its money across many teams. The public data shows the total, not the depth, so a high ranking on total spending is a starting point for the conversation, not a finish line. The schools that look most ready on paper may be the ones that would have to contract their sports offerings to actually make the jump, and some of them, like Virginia State, have decided that breadth is worth more to their athletes than a division change.
What the Data Can and Cannot Show
The public athletics financial data for the 2023-24 school year lets us rank these programs on the things that matter for a move up: how much they spend in total, how much they spend on football, how much athletic aid they award, and how large a student body they draw from. It does not contain the academic measures, so the APR and Graduation Success Rate questions remain open for every school on this list. It also does not include Morehouse College, whose athletics figures are not broken out in the available data, so the very program whose director started this conversation cannot be placed in the ranking. That gap is worth stating plainly rather than filling with an estimate.
With those limits noted, here is where the Division II HBCUs stand on total athletic spending, the single best proxy in this data for the scale of a program.
| School | State | Undergrads | Football Spend | Athletic Aid | Total Athletic Expenses |
|---|---|---|---|---|---|
| Virginia State University | VA | 4,876 | $1,827,489 | $2,098,153 | $9,315,469 |
| Clark Atlanta University | GA | 3,530 | $2,997,063 | $3,128,445 | $8,058,158 |
| Bowie State University | MD | 4,302 | $1,519,569 | $1,130,616 | $7,386,532 |
| Winston-Salem State University | NC | 3,758 | $2,145,957 | $1,687,482 | $6,733,477 |
| Fayetteville State University | NC | 4,359 | $1,358,522 | $1,344,653 | $6,605,296 |
| Tuskegee University | AL | 2,555 | $2,495,545 | $1,446,851 | $5,773,045 |
| Shaw University | NC | 821 | $1,304,306 | $2,527,429 | $5,502,050 |
| Edward Waters University | FL | 1,020 | $1,137,062 | $2,090,087 | $5,469,614 |
| Benedict College | SC | 1,487 | $1,477,509 | $2,334,874 | $5,466,026 |
| Central State University | OH | 2,063 | $1,381,917 | $1,325,889 | $4,592,772 |
| Johnson C. Smith University | NC | 1,205 | $2,111,118 | $2,089,564 | $4,446,973 |
| Miles College | AL | 1,119 | $1,816,670 | $1,250,214 | $4,207,874 |
| Kentucky State University | KY | 1,162 | $1,252,224 | $727,046 | $4,079,832 |
| Elizabeth City State University | NC | 1,796 | $1,154,144 | $780,464 | $4,076,264 |
| Virginia Union University | VA | 1,136 | $1,617,306 | $1,874,347 | $4,046,046 |
| Lincoln University | PA | 1,503 | $912,545 | $1,093,000 | $3,722,951 |
| Fort Valley State University | GA | 2,432 | $1,106,162 | $696,664 | $3,629,121 |
| Lane College | TN | 719 | $1,037,739 | $935,726 | $3,446,247 |
| Savannah State University | GA | 2,501 | $549,887 | $858,138 | $3,377,772 |
| Claflin University | SC | 1,595 | no football | $858,740 | $3,269,196 |
| Albany State University | GA | 4,428 | $1,355,220 | $814,445 | $3,208,383 |
| Livingstone College | NC | 909 | $1,152,621 | $1,571,380 | $3,186,871 |
| Allen University | SC | 560 | $853,664 | $1,220,618 | $3,009,939 |
| Le Moyne-Owen College | TN | 530 | no football | $343,411 | $1,628,371 |
Source: U.S. Department of Education Equity in Athletics data, 2023-24 reporting year. Figures reflect Division II HBCUs only; two non-HBCU institutions and one program competing outside the NCAA were excluded from the ranking.
Measuring the Candidates Against the Division I Floor
To judge readiness, it helps to know how low the bar actually sits. Using the same federal athletics data that produced the table above, the leanest full football program in the Division I HBCU group is Mississippi Valley State University. It awards about $1.2 million in athletic aid, the smallest figure in the entire 23-team cohort, and funds football at 36.3 scholarship equivalencies, which is the Division II maximum rather than the Division I one. The scholarship floor of Division I football, in other words, is remarkably low, and it is close to what the strongest Division II HBCUs already fund.
Measured against that floor, the comparison is not close. Clark Atlanta awards about $3.1 million in athletic aid, more than several current Division I HBCU programs, including Alcorn State University, Bethune-Cookman University, and the University of Arkansas at Pine Bluff. Shaw, Benedict, Virginia State, Edward Waters, and Johnson C. Smith each award more than $2 million, comfortably above the commitments of Mississippi Valley State and Coppin State University at the Division I level. One caution belongs here. North Carolina A&T State University’s federal filing reports only about $2.4 million in athletic aid, a figure that sits well below what a program of its enrollment and revenue actually invests and is best read as a reporting anomaly rather than a genuine floor. Set that aside and the pattern still holds: on scholarships, the top Division II HBCUs are not trailing the Division I floor. Several are ahead of it.
Scholarships are only one line, though, and the full budget is where Division I pulls away. The 23 Division I HBCU programs spent a combined $314.7 million on athletics in 2023-24, averaging about $13.7 million per program. Even Virginia State, the top Division II spender at $9.3 million, sits below that average, and most of the field sits far below it. The leanest Division I programs can be matched on scholarships, but the middle of the cohort, which is what sustainable membership actually looks like, sits well beyond where any Division II HBCU operates today.
Put the two facts together, and the picture sharpens. In terms of aid, the strongest Division II HBCUs already match or exceed the Division I floor. On the total budget, reaching the Division I middle would take nearly double what the NCAA’s own reclassification data predicts. The distance between those two truths is where the real question lives.
The Top Tier: Where the Numbers Line Up
Two programs separate themselves at the top, and they do it for different reasons.
Virginia State spends the most of any Division II HBCU, at more than $9.3 million, and it draws from the largest student body on the list at nearly 4,900 undergraduates. Based on the raw numbers, the Trojans look like the most complete Division I candidate in the group; it sits in the middle of MEAC territory, and it carries the kind of academic and research profile that would comfortably clear the new eligibility bar. But its own athletic director has already applied the brake, and her explanation is the most useful piece of context in this entire discussion. The spending is real, but it is spread across 21 sports, and Sykes has been clear that funding all of them at the Division I level, rather than fielding a smaller, better-resourced lineup, is what stands between Virginia State and a move it could otherwise make. Virginia State is proof that the top of the spending table is not automatically the front of the line.
Clark Atlanta makes the other strong case. It spends just over $8 million, and it leads the entire field in the two categories most directly tied to the new requirements: football spending at nearly $3 million and athletic aid at more than $3.1 million. Athletic aid is the number that speaks most directly to the scholarship floor the NCAA now enforces, and Clark Atlanta already funds it at a level no one else on this list matches.
It is also the only program here reporting athletic revenue well above its expenses. It is also a research university in its own right, which strengthens its case against the academic thresholds the move now requires. Atlanta is a major media market with no SWAC member currently in Georgia, which gives the fit a logic beyond the balance sheet. The harder questions are financial and structural. Clark Atlanta is private, so the roughly $3.2 million in new annual funding the move demands cannot come from a state appropriation or a large mandatory student fee base, as it can at a public university, and its enrollment is smaller than that of the publics it would join. Finding that subsidy year after year, on top of a near-doubling of the athletics budget, is a steeper climb for a private institution than the raw spending figure suggests.
The Middle Tier: Real Size, Specific Gaps
A cluster of large public universities sits just behind the leaders, each with a credible case and a specific thing to fix. As public institutions, they hold one structural advantage that private candidates do not: enrollment large enough to generate meaningful student-fee revenue and access to state support, the two funding sources the NCAA identifies as the most common ways reclassifying schools cover the annual gap.
Bowie State spends more than $7.3 million and enrolls over 4,300 students, so the scale is there. Its athletic aid, at about $1.1 million, is thin relative to that budget, and it would need to grow to approach a Division I scholarship model. Maryland also already has three MEAC members, which weakens the market argument for adding a fourth.
Winston-Salem State and Fayetteville State are close companions in this data, each spending between $6.6 and $6.7 million, with enrollments near or above 3,700. Both have the institutional size that a conference looks for. Winston-Salem State also carries the most instructive history on this entire list, because it has done this before.
The school decided to move up in 2004, gained provisional membership in the MEAC, and spent several years transitioning before its chancellor ended the attempt in 2009. The reason was almost purely financial, and it maps precisely onto the pattern the NCAA would later document. Winston-Salem State’s athletic expenses nearly doubled during the attempt, climbing from about $2.88 million to $5.58 million, while revenue rose only modestly, leaving the department roughly $2 million in debt. At the time, close to 80 percent of the athletic budget came from a single source, student fees, and even though Winston-Salem State carried the second-highest athletic fee in the University of North Carolina system, that fee was still among the lowest in the MEAC. With a smaller student body than its conference rivals, the school concluded it would always be at a structural disadvantage.
What has changed since 2009 is where the money can come from. Winston-Salem State now has a funding tailwind it did not have then. North Carolina recently began steering sports wagering tax revenue to its public HBCUs, and the state’s 2026 budget, which raised the online wagering tax to 23 percent, guarantees Winston-Salem State a $300,000 annual floor payment as a Division II school. The larger shares, which can push a school’s annual total toward $3.6 million, are reserved for North Carolina’s Division I HBCUs. That structure cuts directly in Winston-Salem State’s favor on the exact question that sank it last time, where the new annual money comes from.
This is revenue that does not post to a student’s bursar account, which is precisely the dependency that undermined the first attempt. It already collects the Division II floor, and moving up would put it in line for a materially larger share, turning the move it is weighing into part of its own funding answer. Fayetteville State, as another public North Carolina HBCU, sits in the same position.
Tuskegee rounds out this group. It spends $5.8 million and commits the second-highest football budget on the list at nearly $2.5 million, and it carries one of the most recognizable brands in HBCU athletics. Its athletic aid and enrollment trail the top tier, so the case rests more on brand and football investment than on total institutional scale. Like Clark Atlanta, Tuskegee is private, so it faces the same question of where the annual subsidy would come from without a state line or a large student-fee base to draw on.
The Rest of the Field
Below roughly $5.5 million in total spending, the programs thin out quickly on the measures that matter for a move up. Several of the highest per-student spenders, including Shaw, Allen, and Livingstone, are funding competitive athletics on enrollments under 1,000 students, which raises the sustainability question a conference would examine closely. Others, like Savannah State, Albany State, and Fort Valley State, bring solid enrollment but sit in the lower half on spending and athletic aid. Savannah State is a special case worth watching, since it competed in Division I in the past decade before returning to Division II, meaning the operational knowledge of Division I membership still exists within the athletic department.
The Morehouse Question
The program that started this conversation cannot be ranked here, because Morehouse’s athletics spending is not broken out in the available data. That is a real limitation, and it would be a mistake to fill it with a guess. What can be said is narrower. Athletic director Harold Ellis has stated the ambition publicly and tied it to a run of on-field success and aggressive scheduling, including games against Division I opponents. Morehouse also brings a national academic brand and, at the institutional level, a balance sheet backed by genuine capacity. Whether its athletics operation is funded at a level near that of the top-tier candidates on this list is a question the public data does not answer. If Morehouse wants to be measured against Virginia State and Clark Atlanta, the athletics figures would need to be visible first.
What These Schools Already Charge Students
There is one more number worth putting on the table because it shows how these programs are funded today and hints at who would pay if the budget climbs. Like their Division I peers, the public Division II HBCUs lean on a mandatory student athletic fee, charged to every student whether or not they ever attend a game. Among the leading public candidates, Virginia State charges the most, followed by Bowie State, Fayetteville State, and Winston-Salem State, with the Georgia publics lower still.
| School | State | Annual Student Athletic Fee |
|---|---|---|
| Virginia State | VA | $1,515 |
| Bowie State | MD | $970 |
| Fayetteville State | NC | $858 |
| Winston-Salem State | NC | $780 |
| Albany State | GA | $400 |
Source: institutional and state university system fee schedules, 2024-25 and 2025-26. Figures reflect the mandatory athletic fee for a full-time undergraduate. Private institutions on the candidate list do not publish a separate athletic fee; those costs are absorbed into tuition and general fees.
Two things stand out. The private candidates, including Clark Atlanta, Tuskegee, and Morehouse, do not levy a separate athletic fee at all, which means they cannot lean on that lever the way the publics can and must fund athletics from tuition, donors, and university-wide support. And the current fees, even the highest, sit below what Division I peers charge. The clearest illustration is in Virginia. Norfolk State University, Virginia State’s longtime in-state rival and a Division I HBCU, charges its students about $1,960 a year for athletics. Virginia State charges about $1,515, which puts it a little over $400 behind its rival on the one revenue line the school most directly controls.
That gap is best read looking forward. Should Virginia State ever join Norfolk State in Division I, its athletic fee would most likely rise to close that roughly $400 gap, if not surpass it, because the higher budget has to be funded from somewhere. History says the student fee is the first place a reclassifying public school turns when the budget has to grow, which is precisely the pattern that ended Winston-Salem State’s last attempt. For Virginia State, matching its rival on the field would probably mean matching it on the student bill as well.
The Bottom Line
On the strength of this data, only Virginia State and Clark Atlanta are spending at a level that touches the floor of Division I HBCU athletics, and even they would have to roughly double those budgets and find about $3.2 million in new money every year to sustain the move. That math reorders the field. Virginia State sits at the top of the spending table and has publicly chosen to stay put, because its budget is built for breadth across 21 sports rather than depth in a Division I lineup. Clark Atlanta and Tuskegee have the athletic profile, but as private institutions, the hardest path to the annual subsidy.
The large publics behind them, Bowie State, Winston-Salem State, and Fayetteville State, have the enrollment and state backing that the NCAA’s own data says reclassifying schools rely on, even as their current budgets sit lower. For the two North Carolina schools, the state’s backing now includes a dedicated share of sports wagering tax revenue, which would likely grow if they moved up. That is the more honest lesson in the numbers: readiness is not just how much a program spends today, but whether the university behind it can absorb a near-doubling of the athletics budget, whether the academics clear the bar, and above all, whether a conference is willing to ask. The MEAC and the SWAC are the only doors into Division I, and no amount of spending opens them without an invitation.